Network Analysis & Troubleshooting
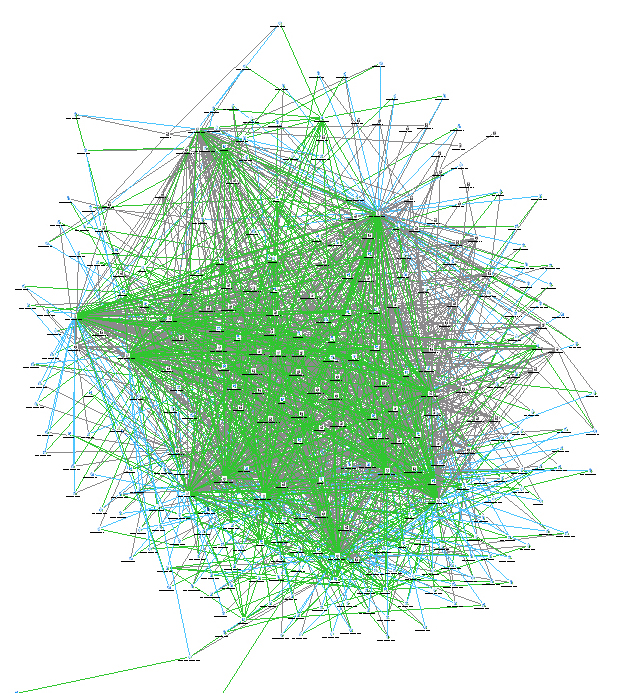
This is an Actual production network under Avaria’s Care.
Can you guess where the problem is?
Should you be guessing ?
At Avaria, we don’t guess. We find the needle.
Contact Us for Expert Help
How do you manage the madness without ending up in a straitjacket?
You can’t troubleshoot what you can’t see … or find … or don’t know.
Avaria troubleshoots business computer networks by pro-actively implementing granular-level end-to-end monitoring with pre-set thresholds. Best-practice network and server management is in our DNA.
That’s why we are infatuated with device & service metrics, alerts; and we provide round-the-clock proactive maintenance. When things exceed threshold values, or simply stop working, our experienced team of engineers focus on immediate remediation and post-failure analysis. And after successful remediation, recommend and implement changes to mitigate similar situation in the future.
Overview
At the most basic level (we won’t bore you with too many details), a business technology network may have:
- Network switches, firewalls and routers, wireless access points, and printers: all of which have CPUs, memory, and operating systems
- All these devices pass all sorts of network traffic; have all sorts of resources utilization
- There are storage devices, which in turn, have their own embedded devices such as network cards, and embedded operating systems, and data traffic (think iSCSI)
- There are physical hosts (e.g. vmware), and then there are guest VMs living on these physical hosts.
- Hosts have their own OS, and physical resources (RAID controllers, network cards, CPUs, memory, system boards etc.).
- Guest VMs present their own set of variables such as virtual CPU (vCPU), virtual RAM, guest OS, and hundreds of services (think RDP, SSH, http, ftp, MS Exchange, SQL, etc) PER VM.
- Let’s not forget power devices such as UPSs and PDUs, which generate their own data.
Once you multiply all of these, you end up with thousands, if not hundreds of thousands, of things that can go wrong. Knowing, in real-time, and with real-time networking knowledge to go straight to the issue, IS HOW AVARIA MANAGES UPTIME FOR YOUR BUSINESS NETWORK.
Avaria’s network management engineers:
- Discover, Inventory and Document ALL of your IT infrastructure resources (end-to-end, single site or multi-sites).
- Set up metric thresholds, implement monitoring, and setup alerts of ALL resources.
- Assign right engineering manpower to tackle the ‘red alarms’.
- Make sure red alarms are tackled within minutes and not hours. Escalation thresholds are managed by account managers and service desk managers.
- And maintain a robust CHANGE MANAGEMENT system. 80%+ problems happen AFTER a change; change management is the only way to go!
Network Topology Discovery & Mapping
| Network Topology Discovery & Mapping |
 |
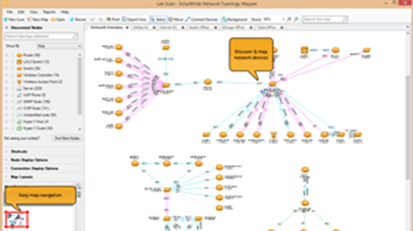
Discover and diagram network topology. Discovery methods including
SNMP, ICMP, WMI, CDP, VMware®, Microsoft® Hyper-V® & more.
Leveraging a unique multi-level network discovery technique, our mapping tools discover your LAN or WAN and we produces a comprehensive, easy-to-view network diagram that integrate OSI Layer 2 and Layer 3 topology data. |
| Multi-Level Network Discovery |
 |
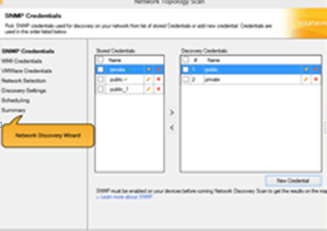
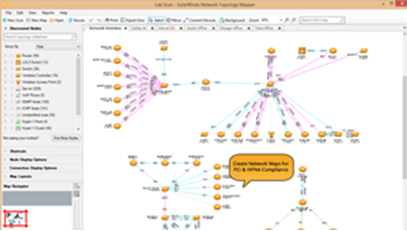
Our powerful network discovery software performs multi-level network discovery to produce an integrated OSI Layer 2 and Layer 3 network map that includes detailed device information. |
| Network Mapping for Regulatory Compliance |
 |
Our powerful network mapping software, Network Topology Mapper, allows you to directly address PCI compliance and other regulations that require maintenance of an up-to-date network diagram. |
Request a Free Network Assessment or More Info on Network Troubleshooting
24x7x365 THRESHOLD-BASED MONITORING, ALERTING & REMEDIATION
(historical data is kept for up to one year by default, for trend analysis)
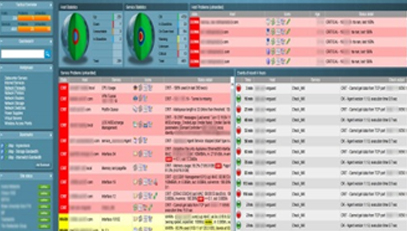
| Datacenter Level Tactical Overview of Assets |
 |
– Real-time Host Statistics (Entire Infrastructure)- Real-time Services Statistics (Entire Infrastructure)- Single-window Problem Hosts & Services- Event based time records
– 24x7x365 services |
| Physical Hosts (in a Virtualized environment) and/or PHSYICAL SERVERS in a Non-Virtualized environment |

 |
– DNS- RAC (CMOS, CPUs, Fans, Power, SSH, Temperature, HTTPS etc.)- ESXi (or other hypervisor) Connection Status- Host CPU usage
– Hypervisor Health
– Hypervisor I/O Status
– Hypervisor Mem (Control, Swap, Usage etc.)
– Hypervisor NET Usage
– Hypervisor Service Status
– Hypervisor Storage Connections
– Host Temperature, Uptime, VM list, VMFS |
| Virtual Servers (VM) – Monitoring/Alerting/Historical Data/Thresholds (warn/crit) & Documentation |

 |
– CPU Usage- Mem & Pagefile Usage- Individual disk volume usage- Disk I/O
– Hardware Events logs
– Key Management Service Logs
– Services such as RPS, HTTPS, SQL, Exchange, Spooler, Antimalware,
W3SVC etc etc)
– Network Interface (in/out data) |
| Firewalls- Monitoring/Alerting/Historical Data/Thresholds (warn/crit) & Documentation |

 |
– Cluster Status- CPU Utilization- Interface Monitoring- Mem Used (mempool_global/mempool_dma etc)
– Mem used System memory
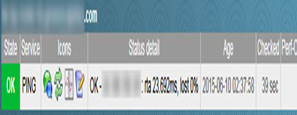
– PING, and Uptime
– VPN Tunnel metrics
– TCP Sessions
– SNMP info for documentation and change management |
| SWITCHES – Monitoring/Alerting/Historical Data/Thresholds (warn/crit) & Documentation |

 |
– CPU Utilization- Fan(s) Monitoring- Temperature- Interface monitoring w/ data in and out per port
– Mem used I/O
– Mem used Processor
– Ping and Uptime
– SNMP info for documentation and change management |
| Routers- Monitoring/Alerting/Historical Data/Thresholds (warn/crit) & Documentation |

 |
– CPU Utilization- Fan(s), FRU Power, Main power, Temperature etc.- Mem used I/O- Mem used processor
– PING/Uptime
– Network Interfaces (data in/out) |
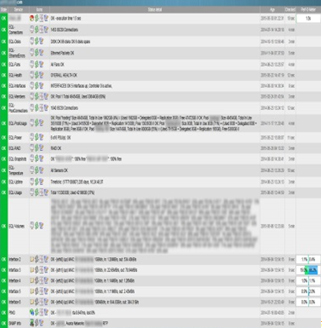
| Storage – Monitoring/Alerting/Historical Data/Thresholds (warn/crit) & Documentation |
 |
– # of iSCSI connections- Disks (individual chassis or the whole pool)- Ethernet Errors- Chassis Health, Fans, Temp, Power, RAID status
– Interfaces and Controllers
– Storage Member Status (for pooled storages)
– Pool connections
– Pool Usage
– Snapshots
– Storage Volumes and LUNs
– PING & Uptime
– SNMP info |
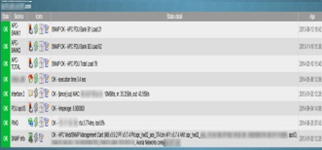
| Power (UPSs & PUDs) – Monitoring/Alerting/Historical Data/Thresholds (warn/crit) & Documentation |
 |
– Load data: PDU SNMP individual bank monitoring- Network Interface monitoring- AMPs being used- PING and uptime
– SNMP information for documentation and change management |
| VoIP (Voice over IP telephone system) Monitoring, including IP phones (if you are glutton for punishment) |

 |
– CPU Load & Utilization- Ping & Uptime- SMB Port Monitoring- System Lic. Subscription (how many days left before expiration)
– Total Current Calls
– Total IP Phones
– SNMP Info |
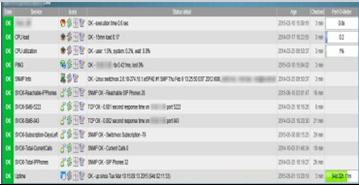
| Networked Printers/MFP (large Canon, Toshiba, Kyocera, Konika/Minolta, Xerox etc) |
 |
– Hard Disk Monitoring
– Network Interface monitoring
– Mem Used
– # of pages printed
– PING/Uptime
– Individual Cartridge Ink Levels |
| Wireless Access Point (WAP) – Monitoring/Alerting/Historical Data/Thresholds (warn/crit) & Documentation also see go to wifi page |

 |
– Average client signal clients (# of client devices)- Average client signal quality (% and also warn/crit levels)- Average client signal strength (dB and also warn/crit levels)- Wireless device CPU Utilization
– Wireless device Network Interface (data in/out)
– Mem Used I/O
– Mem Used Processor
– QoS Dot11Radio0.5: _class_SVP0
– QoS GigabitEthernet0.5: _class_SVP0
– QoS GigabitEthernet0.5: class-default
– PING/Uptime |
Non-Avaria Router (such as Time Warner Cable/ISP modem)
We monitor all small business clients ISP routers and modem for any outages/latency |

 |
– Up/Down- Ping- Disconnected |
Request an Assessment or Troubleshooting Session for your Network
